Can your budget support this monthly contribution for the full period, even when returns are lower or costs are higher than the base assumptions?
What this calculation means
Compounding means that a later return is applied to both contributed principal and growth already accumulated. The long-run result does not come from the return assumption alone: it also depends on how much can actually be contributed each month and how long those contributions remain invested.
This calculator adds the monthly contribution before applying a return at the selected monthly, quarterly, or yearly boundary. It therefore models beginning-of-month contributions. A product that invests at month-end, values assets daily, or receives irregular deposits will follow a different path even when the stated annual return is the same.
The after-tax balance applies the editable tax percentage once to positive growth. Changing the display currency does not select a residence, account type, or tax jurisdiction, so the estimate should not be read as a tax filing result or as the amount an investor will necessarily receive.
Affordability is easier to judge by reading contributed principal, the lower-return case, fee drag, and inflation-adjusted purchasing power together. If the monthly amount would crowd out ordinary expenses or an emergency reserve, changing the duration or target is more informative than raising the assumed return until the result fits.
Formula and calculation order
At a compounding boundary: B_m = (B_(m-1) + C) × (1 + r / n)
Variables used by the compound-interest calculation
Symbol
Variable
Meaning and unit
B_m
Balance after a compounding boundary
Displayed-currency balance after the contribution and applicable periodic return in month m
B_(m-1)
Previous balance
Contributed principal plus growth accumulated through the preceding month
C
Monthly contribution
Displayed-currency amount assumed to be added at the same point each month
r
Annual return
The entered annual percentage divided by 100; it is an assumption, not a quoted promise
n
Compounding periods per year
12 for monthly, 4 for quarterly, and 1 for yearly compounding
t
Duration
The entered whole number of years, with 12 × t monthly contributions
P_total
Total contributed principal
Starting principal + monthly contribution × 12 × t
τ
Tax assumption
A user-editable simple rate applied only when the calculated growth is positive
f
Annual fee
The rate subtracted from r when the fee comparison reruns the calculation
i
Inflation assumption
The annual rate used to express the after-tax nominal balance in present purchasing power
Begin with the starting principal and add C before each monthly return step.
At a selected monthly, quarterly, or yearly boundary, apply r / n to the balance at that point.
Subtract total contributed principal from the ending balance and apply τ only to positive growth.
Rerun the same inputs at r - f for the fee comparison, and divide the nominal after-tax balance by (1 + i)^t for purchasing power.
Calculate the three scenario rows at the entered return minus two percentage points, unchanged, and plus two percentage points.
Worked examples
Example 1: combining a starting balance with 20 years of contributions
This example starts with KRW 10,000,000, adds KRW 500,000 before each monthly return, and assumes a 5% annual return for 20 years. The 15.4% tax, 0.3% annual fee, and 2% inflation values are all editable comparison assumptions.
Inputs for example 1
Item
Input or output
Starting principal
10,000,000 KRW
Monthly contribution
500,000 KRW
Expected annual return
5%
Duration
20 years
Compounding frequency
Monthly
Editable tax assumption
15.4%
Annual fee
0.3%
Inflation assumption
2%
Display currency
KRW
Calculated outcomes for example 1
Item
Input or output
Total contributed principal
130,000,000 KRW
Balance after the tax assumption
217,560,625 KRW
Balance in present purchasing power
146,412,064 KRW
Balance recalculated with the fee-adjusted return
210,266,435 KRW
Read the nominal after-tax balance beside purchasing power and the fee-adjusted rerun, rather than treating nominal growth alone as the decision. Under these inputs, subtracting the 0.3% annual fee assumption changes the after-tax result by about 7,294,190 KRW; this is an illustration of compounding assumptions, not a forecast.
Example 2: starting with monthly contributions and no initial principal
The second example begins at zero, contributes KRW 300,000 each month for 10 years, and uses a 4% annual return compounded monthly. Its smaller contribution and shorter duration make the saver’s own contributions easier to distinguish from growth and cost assumptions.
Inputs for example 2
Item
Input or output
Starting principal
0 KRW
Monthly contribution
300,000 KRW
Expected annual return
4%
Duration
10 years
Compounding frequency
Monthly
Editable tax assumption
15.4%
Annual fee
0.2%
Inflation assumption
2%
Display currency
KRW
Calculated outcomes for example 2
Item
Input or output
Total contributed principal
36,000,000 KRW
Balance after the tax assumption
43,040,574 KRW
Balance in present purchasing power
35,308,262 KRW
Balance recalculated with the fee-adjusted return
42,641,654 KRW
Total contributed principal is 36,000,000 KRW in this example. If the monthly amount does not fit the household cash flow, adjust the contribution, duration, or target and calculate again rather than selecting a higher return merely to close the gap.
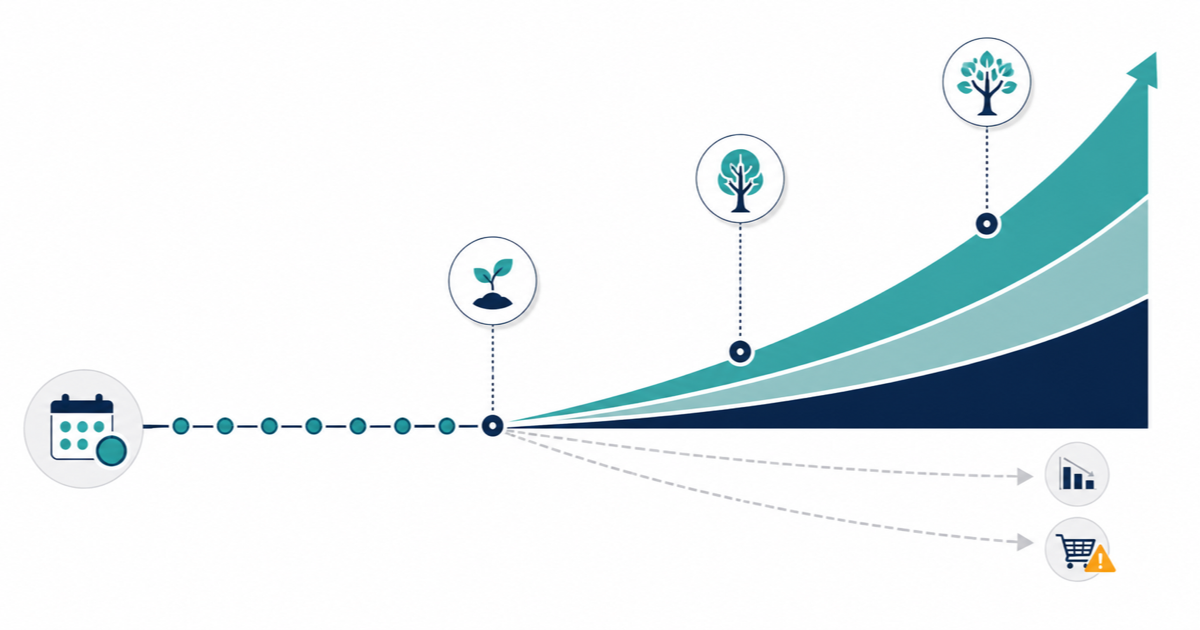
Show in one view how repeated monthly contributions and time widen a compounding path while fees and inflation pull the usable outcome lower.
This is a conceptual visual, not a numeric result. Amounts and differences come from the contribution, duration, return, tax, fee, and inflation assumptions entered in the calculator.
A stream of monthly contributions moves through early, middle, and long-term checkpoints into a widening growth curve, while two small resistance paths below represent the cumulative drag of fees and inflation.
The curve reflects the engine’s separation of contributed principal from accumulated growth over time, but its height and spacing do not encode any particular return or amount.
Costs and conditions to check
A nominal balance is the number of currency units at the future date. Real purchasing power discounts that balance by the entered inflation rate. Treating the two as equivalent can overstate how much a long-term target could buy.
The annual fee comparison assumes that the fee reduces the annual return each year. Actual products can charge management, trading, foreign-exchange, or performance costs at different times, so the product documents remain necessary.
The tax percentage is a one-step assumption applied to positive growth. It does not model realization dates, loss offsets, allowances, account wrappers, product rules, or residence, and it cannot replace an actual tax calculation.
Inflation is held constant for the whole duration. Actual inflation changes over time, and the prices most relevant to one household may not move with a broad consumer-price measure.
Every monthly contribution is added before the return step. Month-end deposits, skipped months, one-off additions, and withdrawals change how long each amount participates in the result.
The one-year delay comparison shortens the contribution schedule while holding the monthly amount constant. It does not assign any return or inflation effect to cash held elsewhere during the omitted year.
Questions for each scenario
First check whether the monthly contribution leaves room for ordinary expenses and an emergency reserve, then ask whether the duration remains workable in the downside case. A higher assumed return cannot make an unaffordable contribution schedule sustainable.
Use the distance between the downside, base, and upside rows as a sensitivity signal. A wide range means the endpoint depends heavily on the return assumption, which can justify a wider target margin or another contribution and duration comparison.
The delay table quantifies the modelled cost of waiting, but it is not a direction to begin with an amount that cannot be maintained. Choose an affordable contribution first, then compare start dates using that same amount.
Nominal balance, purchasing power, and fee-adjusted outcome
Starting with the baseline after-tax nominal balance, the table separately applies the 2% inflation conversion and the rerun using a return reduced by the 0.3% fee. They answer different questions and are not combined into one deduction.
Baseline outcome under the cost and inflation assumptions
Comparison basis
After-tax comparison balance (KRW)
Difference from nominal after-tax balance (KRW)
Nominal after tax
217,560,625 KRW
0 KRW
Inflation-adjusted purchasing power
146,412,064 KRW
71,148,561 KRW
Fee-adjusted return rerun
210,266,435 KRW
7,294,190 KRW
Displayed amounts are rounded to whole won, while the engine retains its unrounded values. The table does not describe any particular product fee or tax rule.
Opportunity cost of starting now versus waiting one year
The starting principal, monthly contribution, return, and tax assumption stay fixed while the contribution period falls from 20 years to 19. This isolates the modeled cost of time; it does not assume what happens to the first-year cash elsewhere.
Starting-time comparison for the baseline example
Starting point
Contribution duration (years)
Total contributed principal (KRW)
Nominal balance after tax (KRW)
Difference from starting now (KRW)
Start now
20 years
130,000,000 KRW
217,560,625 KRW
0 KRW
Start in one year
19 years
124,000,000 KRW
202,060,231 KRW
15,500,395 KRW
The modeled one-year difference is 15,500,395 KRW. It includes both twelve fewer contributions and less time for those amounts to participate in growth.
Downside, base, and upside return range
The calculator compares the baseline contribution, duration, and tax inputs at two percentage points below the 5% base return, at the base return, and two points above it. The upside row is a sensitivity boundary, not a target or prediction.
Nominal after-tax balance by return scenario for the baseline example
Scenario
Assumed annual return (%)
Nominal balance after tax (KRW)
Downside
3%
174,642,512 KRW
Base
5%
217,560,625 KRW
Upside
7%
275,825,094 KRW
All three rows hold the annual return constant in every year. They omit return sequencing, volatility, contribution interruptions, and withdrawals.
Common mistakes
Reading the expected annual return as a rate that repeats with certainty every year
Treating a future nominal balance and inflation-adjusted purchasing power as the same amount
Assuming the annual fee input includes every charge made by a real product
Expecting a display-currency change to apply that country’s tax rules
Ignoring the calculator’s beginning-of-month contribution sequence when deposits occur at another time
Planning only from the base result without testing a lower return or a contribution interruption
Questions to consider
Is the 15.4% default a tax rate that must apply?
No. It is an editable educational starting assumption. Actual treatment depends on residence, account, product, and realization, so current tax-authority guidance and account documents remain necessary.
Is the annual fee automatically deducted from the main result?
The calculator shows the main after-tax balance separately, then reruns the same inputs at the expected return minus the annual fee. A real product may assess costs at different times and on a different base.
Are contributions modeled at the beginning or end of each month?
They are added before that month’s return step. Month-end investing, irregular deposit dates, skipped contributions, or withdrawals can produce a different result.
Should the upside scenario be used as a target return?
No. It is simply the same engine run two percentage points above the entered base return to show sensitivity. It says nothing about probability or suitability.
What is included in the one-year delay difference?
The calculation shortens the duration by one year while keeping the starting principal and monthly contribution unchanged. It does not include any return or inflation effect on cash held elsewhere during the delay.
Calculation scope and evidence to check
The U.S. Securities and Exchange Commission’s Investor.gov compound-interest calculator is an educational source for how starting principal, monthly contributions, time, return, and compounding assumptions affect money growth.
The Japan Financial Services Agency explains the basics of long-term, regular, and diversified investing. Both official sources support education, not country-specific tax treatment. The 15.4% default remains an editable simplified assumption.
Every displayed amount comes from the stated inputs and calculation sequence: contributions enter before the monthly return step, the simplified tax rate applies only to positive growth, and the fee, inflation, delay, and return-range comparisons use the same calculation basis.
This global calculator embeds no official country tax rule, product return, or inflation forecast. Before acting, check the selected account and product’s current fee documents, the relevant tax authority’s guidance, and the actual contribution record independently.